I would argue that NotebookLM from Google is one of the easiest ways to begin to leverage AI in your science classroom. If you haven’t engaged with it and you are a reluctant AI adopter (or just someone who hasn’t had the time to move beyond ChatGPT), I would encourage you to take the next two minutes to scan through this post (and consider this the big nudge you have been waiting for).
After a brief explanation of NotebookLM, I will provide a couple potential use cases / examples for elementary educators and for upper school educators.
Using NotebookLM is unlike using other Large Language Models (LLM) like Chat GPT in that each notebook you create (or your students create) operates and draws insight from a set of sources that you or your students upload – not whatever the LLM has been trained on (like the entire Internet). You can upload almost anything to serve as ‘source’ information – including PDFs, websites, YouTube videos and text. When you query the language model, it will draw from one, several or all of your uploaded sources.
This means that, while NotebookLM can put forward inaccurate information, it is going to do so a lot less frequently than other LLMs. And if the sources of information that are uploaded to the notebook are vetted by you and the prompts are specific – inaccurate information is way less likely. A lot of concerns about students engaging with LLMs can be avoided when an LLM is drawing from a small, personally curated group of sources. There is also a super user friendly “studio” within NotebookLM to create – in just one click – any one of the following from some or all of the sources:
- A podcast (with multiple presenters)
- A Mind Map
- A Quiz
- Flashcards
- An Infographic
- A Data Table
- A Slide Deck
- A Video Overview
- A Report
I hope your head is already spinning with possibilities. This means you can curate information that is used by you or by your students to create a myriad of resources for engagements and to support student learning. I focus on Infographics in this post because they are the easiest to make sense of in this format (a post) but many of the other studio options are arguably more powerful.
The Next Generation Science Standards – the standards most of us use in our science classes – have been developed from core information first organized coherently in A Framework for K-12 Science Education (free PDF download here). In the example below, I first created a “notebook” in NotebookLM by uploading the NGSS Disciplinary Core Ideas (content) from pages of A Framework for K-12 Science Education based on a unit about ecosystems (pages 142 – 155 of A Framework).
I then asked NotebookLM to create an infographic that did not go beyond the 3 – 5 gradeband understanding of this content (because this is how the information is organized in A Framework) .
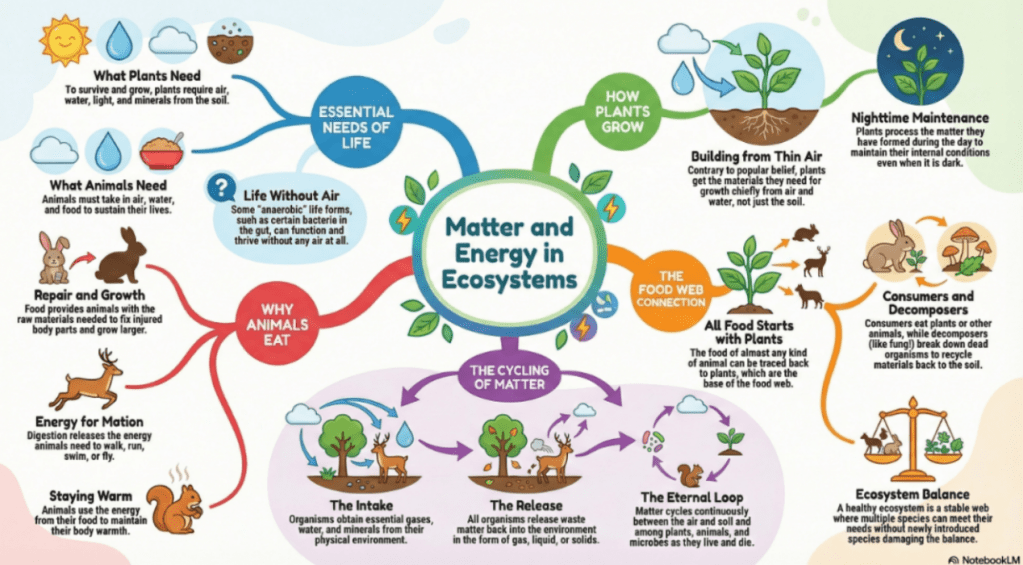
I am sure there are many ways we can all imagine using this infographic in the classroom. Ultimately, this is a model. How are the models we constructed in our classrooms similar or different? Do we have any noticings or wonderings about this infographic? Where do we see the key ideas we have explored around our anchor phenomenon in our unit in this infographic?
If you as an educator are perhaps not super confident about the science ideas in your unit, go ahead and ask NotebookLM to create a podcast from the pages in A Framework for K – 12 Science Education that have the content for your unit, then listen to it while you go for a walk or drive to school. Create a video overview or flashcards or a quiz for your students. Many of the resources K – 5 educators are using (like Amplify or OpenSciEd) have science background teacher information. Plugging this into NotebookLM as a ‘source’ and asking for a podcast or video might be easier for you as a way to build background knowledge.
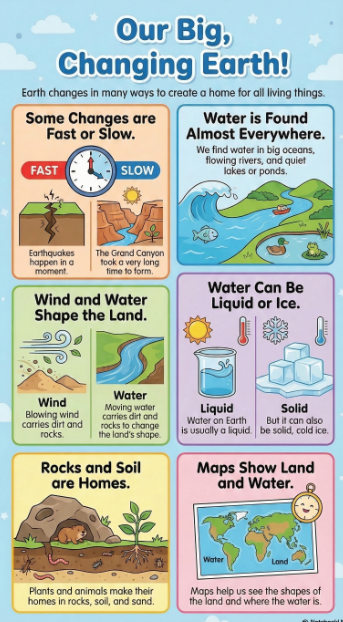
In another example (below) I used the Earth’s Systems section from A Framework and asked that the infographic not go beyond the K – 2 grade band. This does a good job of summing up the grade 2 unit about fast and slow changes. Here is the prompt I used to restrain NotebookLM from going beyond the garde band, “Could you please create an infographic founded in this information that does not go beyond the K-2 grade band?.” I think it worked pretty well : ).
When I taught IB and AP Biology, I used the Biology textbook by Jane Reece and Neil Campbell. I love that text : ). I wondered what NotebookLM would do with the chapter about carbon, so I uploaded it to NotebookLM and asked the studio to make an infographic.
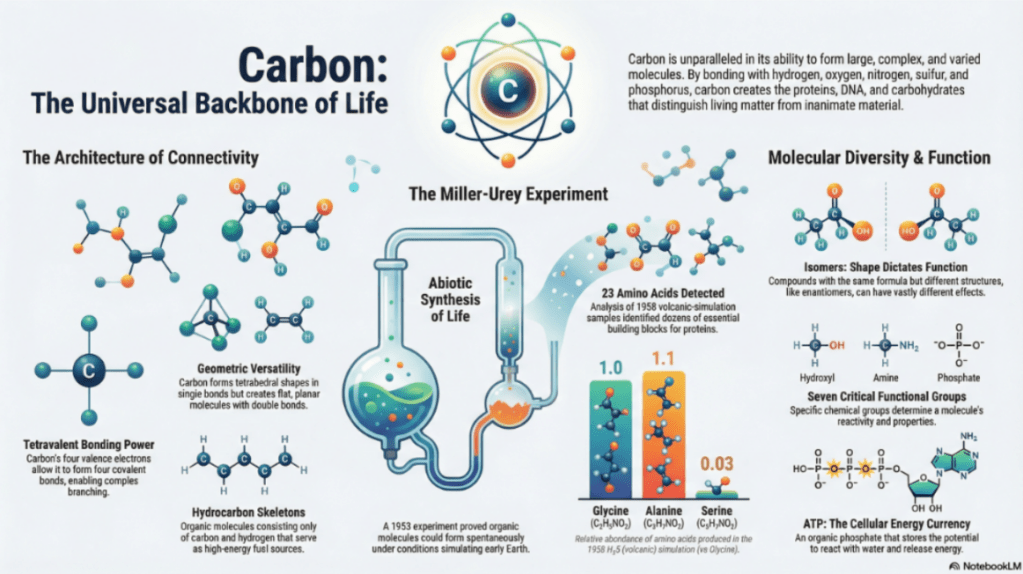
This whole process took me about five minutes. It did take NotebookLM a few minutes to generate. I can see many ways this might be useful. It might be interesting to start the unit with this infographic, asking students to think-pair-share about what they might notice and wonder or perhaps what they might be familiar with already, what they are curious about etc. Towards the end of the learning, what might students think NotebookLM got right / wrong? What’s missing? Overhyped? (I know I have my own opinions about this). What if we create a separate infographic based on content from a similar but different source? How do they compare?
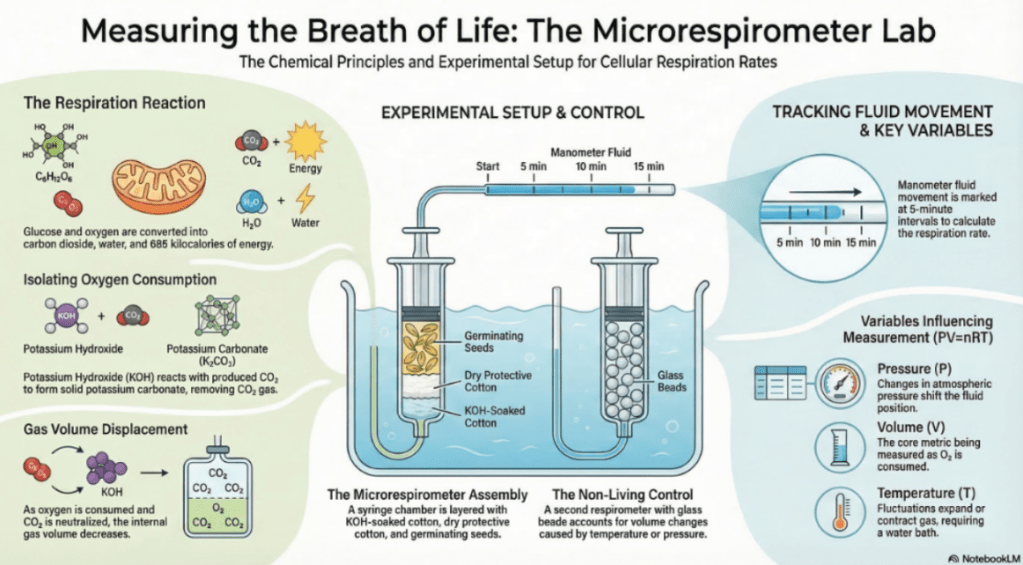
In this second example (below) I uploaded the AP Biology Student Lab 6: Cellular Respiration and asked for an infographic. Similarly, I can imagine myriad ways of engaging students with the ideas around this lab (pre / post / review prior to exam) using this infographic.
The hardest part of engaging with NotebookLM is determining and uploading your sources – and that’s not hard at all. Once that is done you are ready to roll. Get started, good luck and have fun.

Leave a comment